Christophe Viau | ARC fellowship
Final report
Fellowship
BI Visualization
@ETS Montreal

This fellowship was about prototyping novel interfaces for BI data exploration with an emphasis on ligthweight client-side interactive and visual exploration of multidimensional datasets.
Team:
Rock Leung
Michael McAllister
Stephen Petschulat
Deejay Johal
Michael McGuffin
Internship 1
Olap Cube Exploration
@SAP Vancouver

The goal was to prototype some light client-side visualizations to guide a user in an Olap cube exploration, inspired by the challenges in a product with code name Pioneer.
Team:
Ed Prinsen
Huma Zaidi
Internship 2
Mobile BI
@SAP Palo Alto

The goal was to implement some interactive prototypes to illustrate ideas developed by John Armitage for mobile BI exploration. The main widget to implement was a collapsible menu made of a percentage column chart, here named a strip chart, to select and filter the dimensions to use in the visualization.
Team:
Christophe Favart
John Armitage
Kayhan Atesci
Fellowship
This ARC fellowship was on visual and interactive exploration of BI data. The initial project was to guide the user to the best dimension to drilldown in an Olap cube exploration task. A prototype was build during the first internship. But a lot of new ideas emerged, mainly about transition between visualizations and hybrid visualizations. A paper was submitted to a conference about hybrid visualization. This subject proved to be an interesting avenue and was an important part of the second internship on mobile BI. A prototype illustrating some animated transitions on a visual menu for dimension selection and filtering was implemented. A higher resolution video of this summary is available.
Internship 1
The original project was to prototype widgets to guide a user for choosing the next dimensions to investigate in an Olap cube exploration process. We developed an AJAX/SVG pivot table querying data in a Mondrian Data cube. The unused dimensions were sorted according to an arbitrary "interestingness" metric. We choosed Z-Score as a metric to help sort dimensions by the importance of their outliers. The rationale was to have the machine detect an outlier, then guide to the dimension most likely to contain another outlier that may explain the first one. A lot of prototypes, variants and new ideas were presented along the way. Documentation is available in the internship report, in the second year report and the slides from the ARCconf presentation.
A paper was submitted to the Infovis conference inspired by some animated transitions developed during the internship. This video shows one prototype where a table is transformed into a matrix of bars, stacked bar charts, scatterplot and even a node-link diagram.
Internship 2
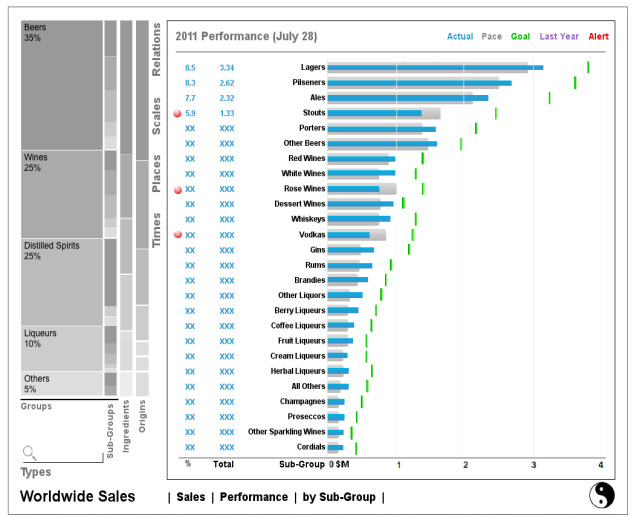
The SAP Palo Alto internship was about implementing a percentage column chart menu called the strip chart for database exploration on mobile devices. The implementation is in Javascript and SVG using the D3.js library. The implementation closely follows a design from the John Armitage's team documented in the Pele Design pdf.
The strip charts is composed of a percentage column charts where each column is called a "strips". Each strip is a stack of "slices", dividing a dimension into equal bins. The height of the slices represents the percentage of values in the bin. This video shows the "strip charts" columns expanding with a click on a header and the bar chart on the main plane updating according to the dimension selected. A cars dataset is used to demonstrate the concept. A higher resolution video is available.
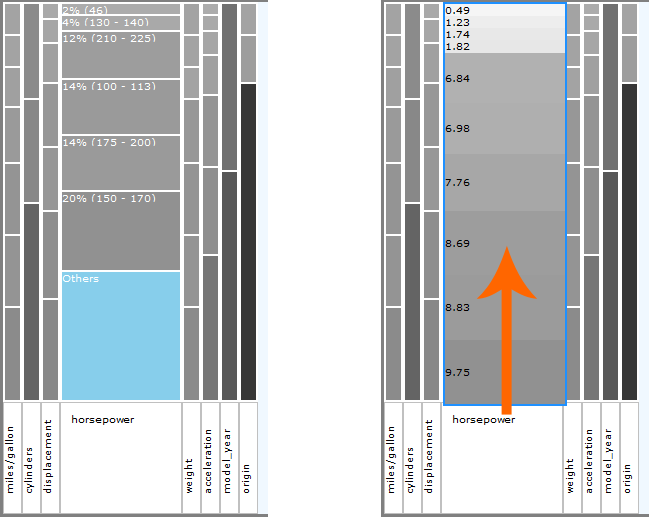
The "Horsepower" strip contains the remaining data in a slice called "Others" that can expand vertically to display the aggregated values.
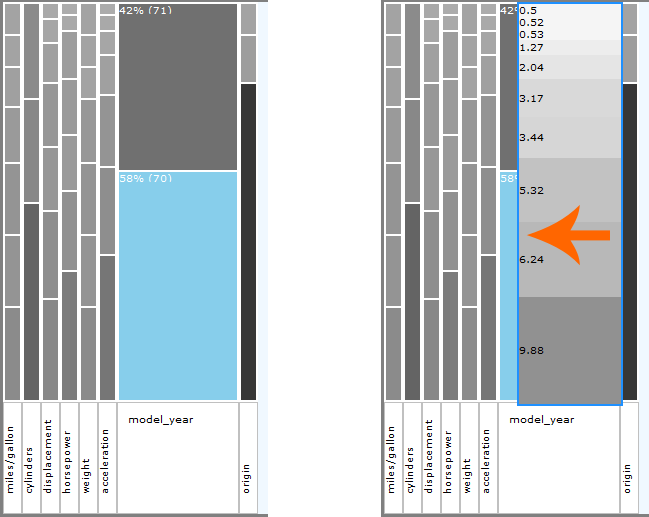
The "Model_year" is a hierarchical dimension and is the aggregation of some underlying data that can be displayed with a flyout strip.
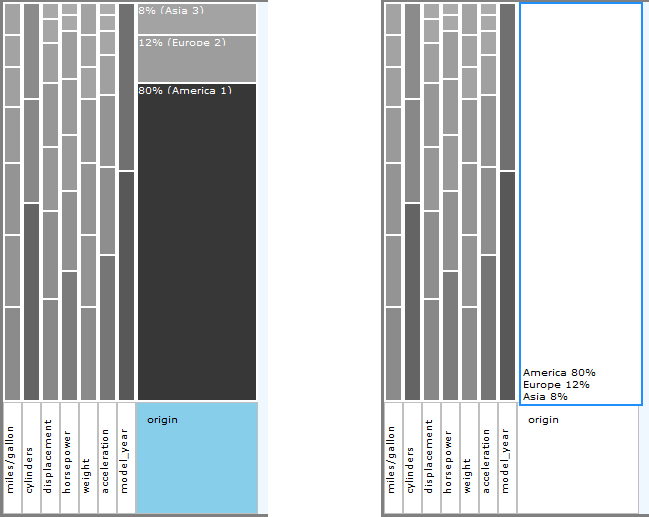
And the "Origin" strip can transition to a simple list fading in.
The prototype runs exclusively on the Chrome browser, and is only use as a proof-of-concept to illustrate part of the interaction in complement to static documentation. The source code is available for download and the demo can be accessed here.